e2maps: Extended Election Maps (2025–2026)
e2maps (Extended Election Maps) transforms how election results are visualized and understood.
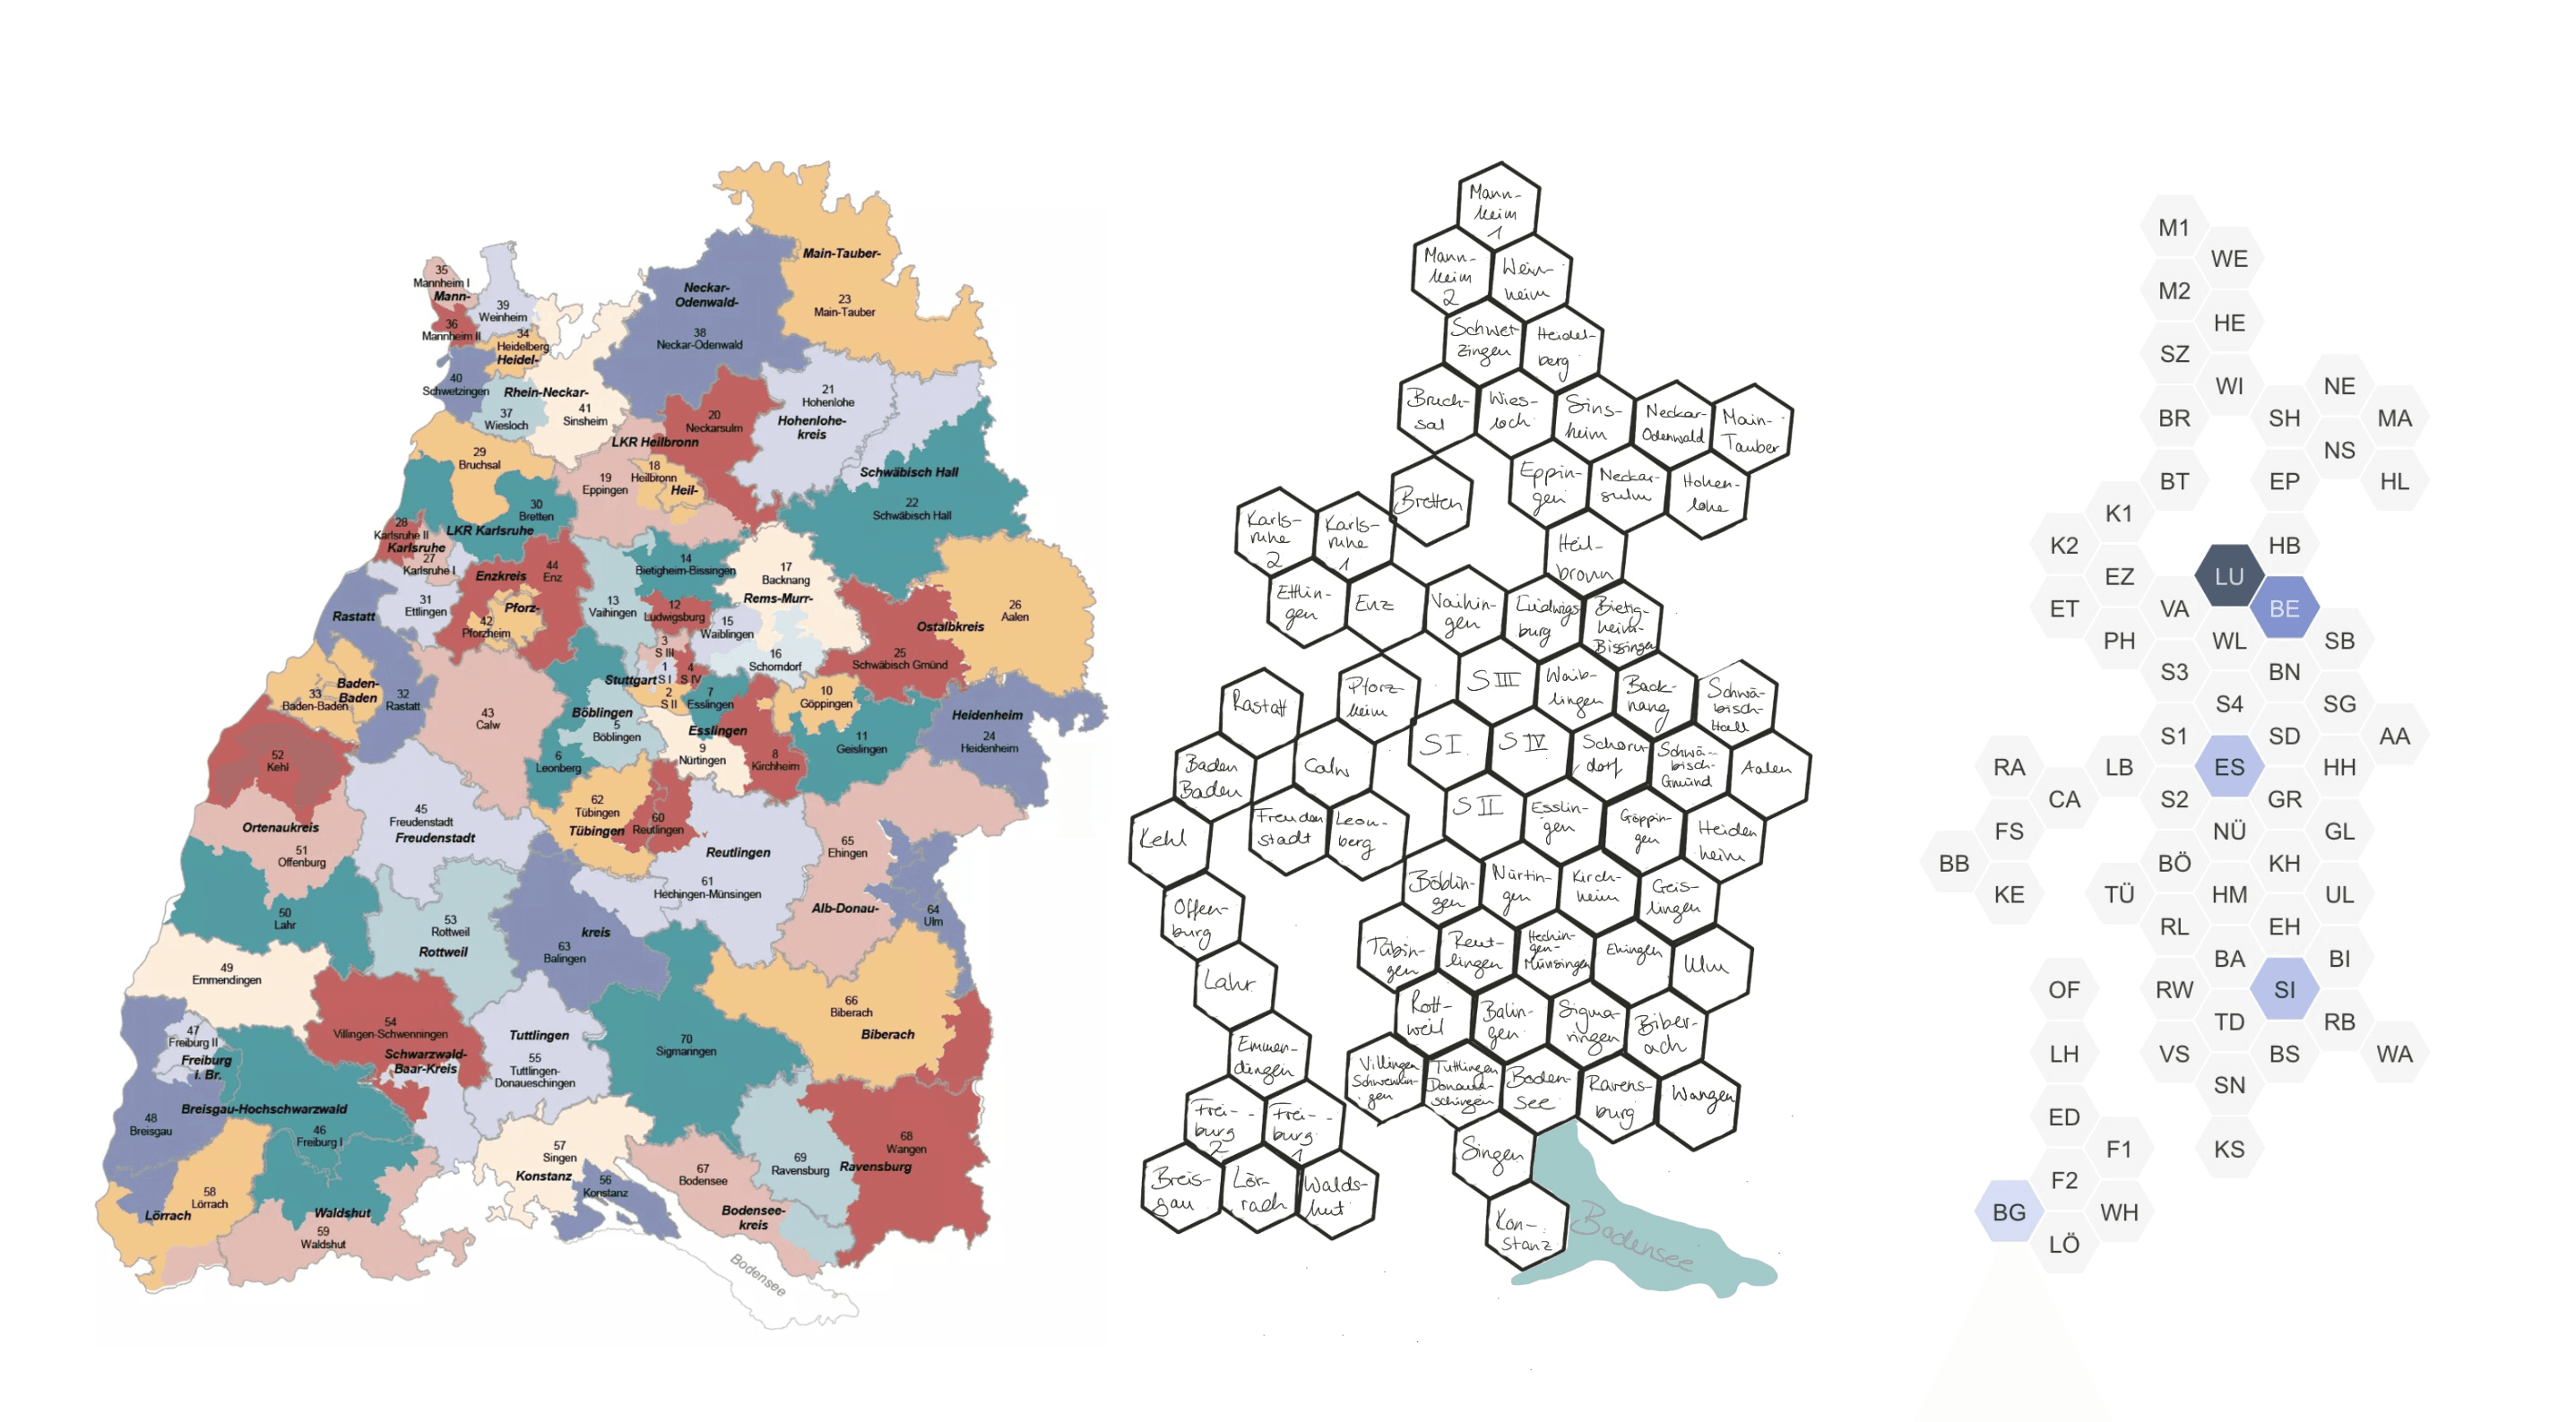
Traditional election maps often show only the winning party in each district, which can oversimplify complex outcomes—especially in proportional voting systems as in Germany. Our approach goes beyond these limitations: based on Tile-Cartograms it reveals the full distribution of votes. Yet, the challenge is to minimize geographic distortions, and to integrating additional context such as turnout or vote shares. In collaboration with DER SPIEGEL, we are translating state-of-the-art visualization research into newsroom-ready tools. The project focuses on creating interactive, open-source, and easy-to-integrate solutions that can be used in journalism, education, and civic engagement. By making election data more transparent, nuanced, and accessible, e2maps aims to support informed public discourse and strengthen democratic understanding.
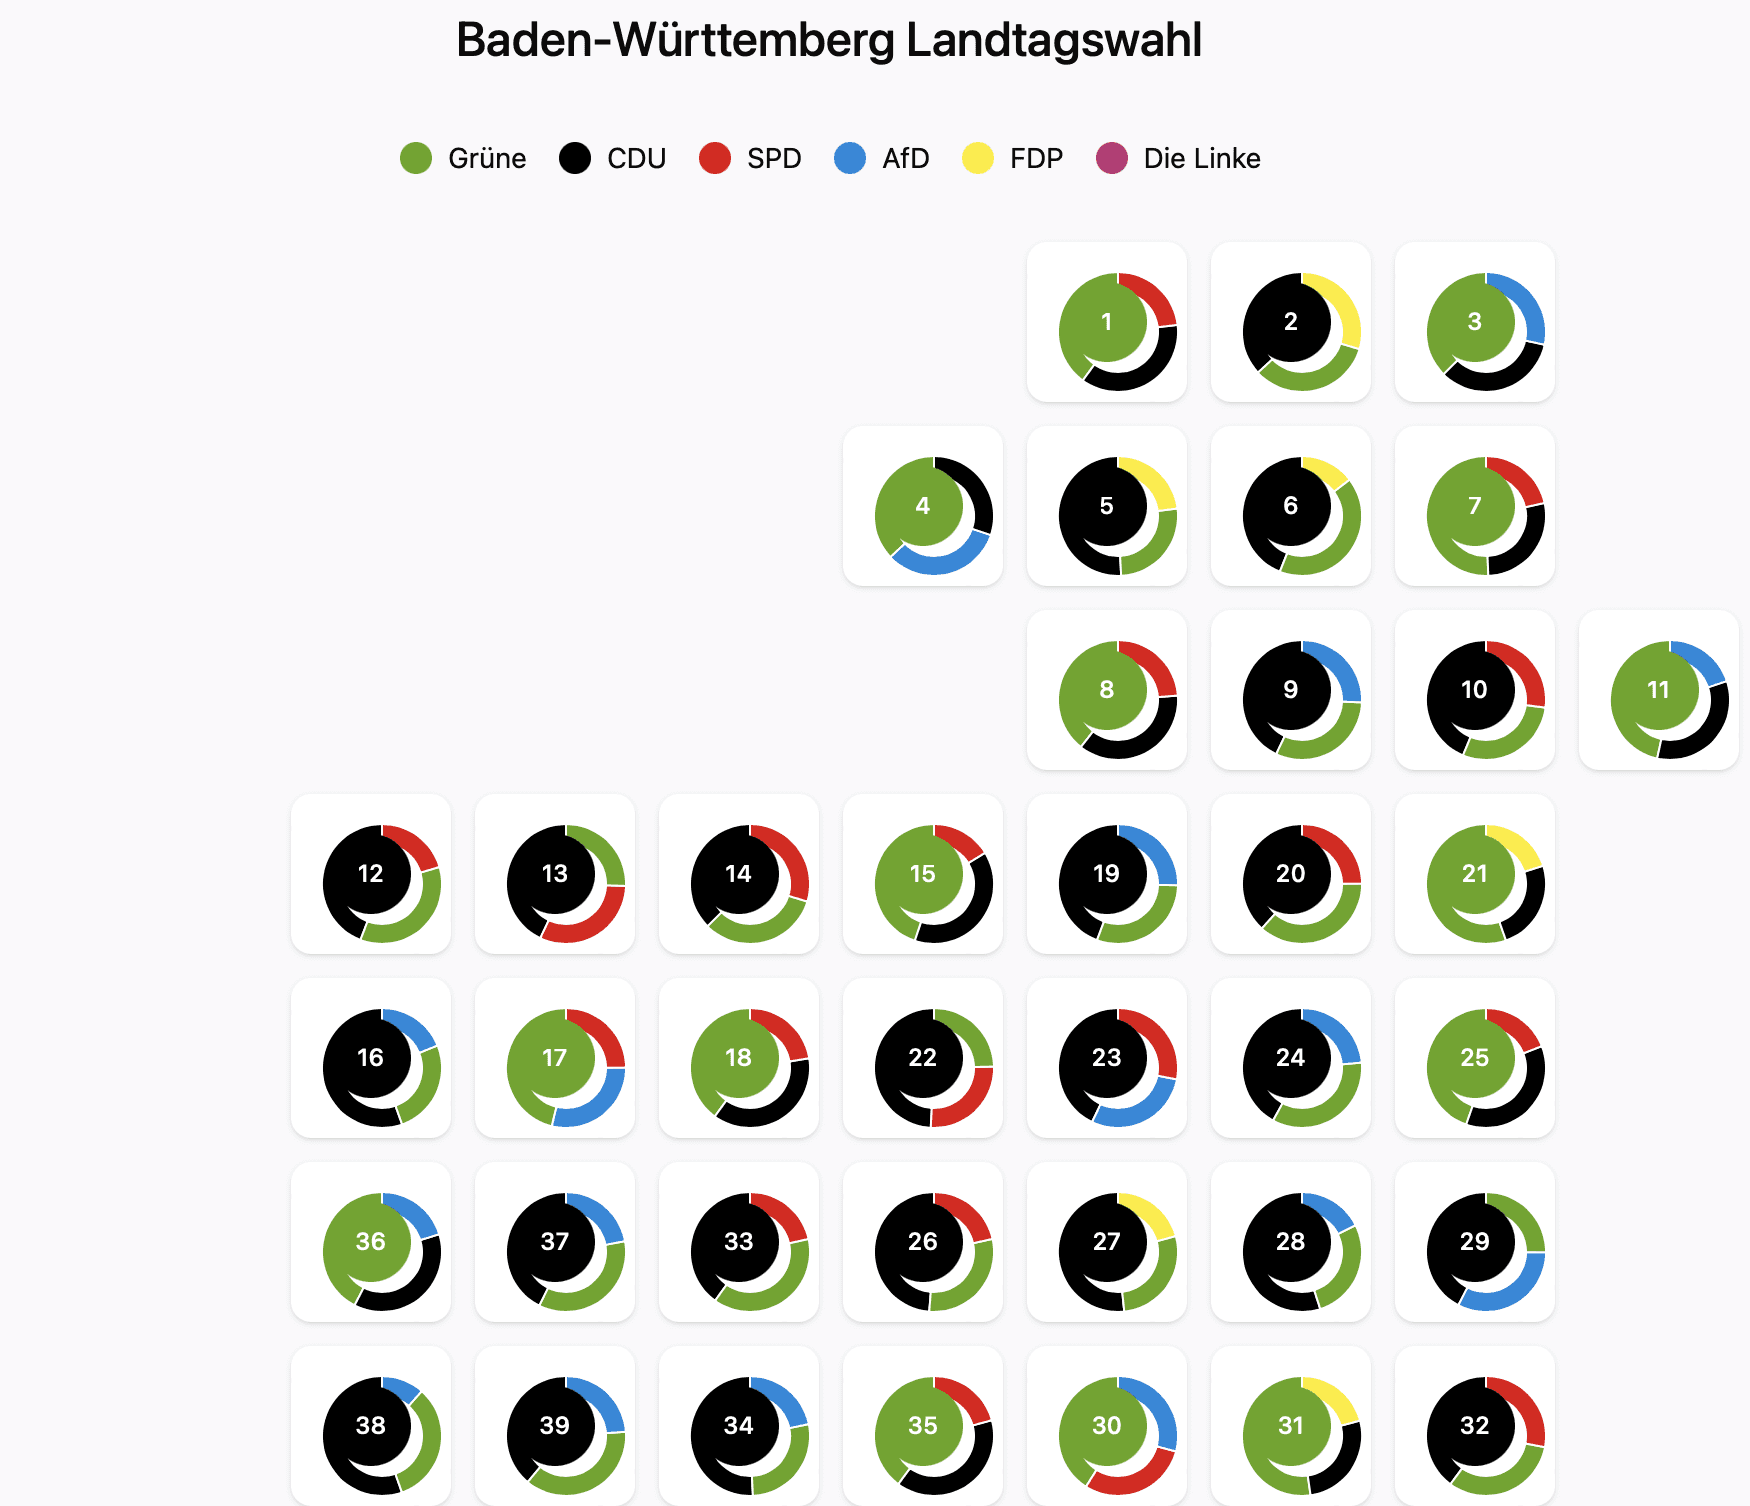
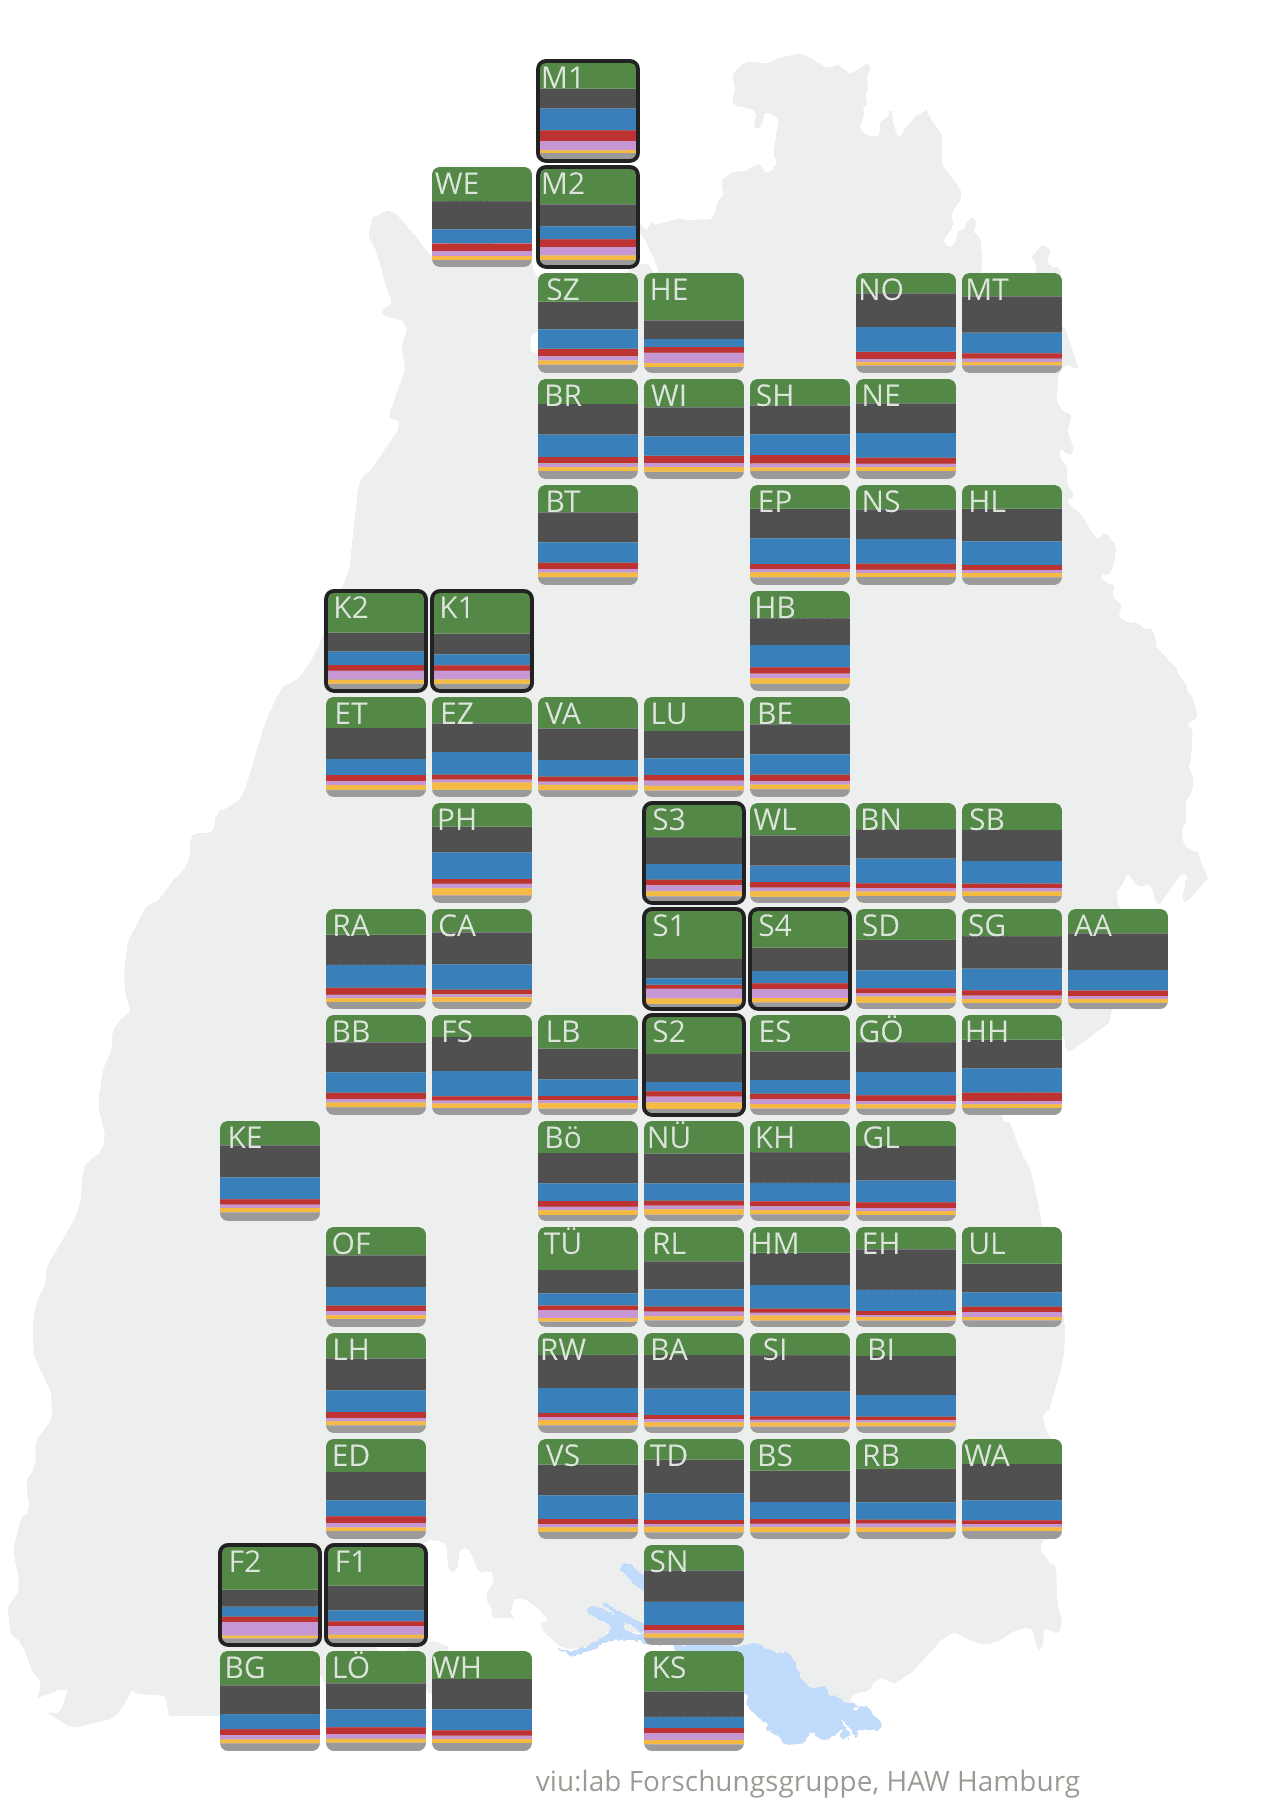
This example map demonstrates the approach with election data from Landtagswahl Baden-Württemberg (March 8, 2026)
This project is funded by Hamburg Innovation as part of the “Calls for Transfer” program (grant C4T1107). .